University of Washington · Composite materials education
Design, characterize,
manufacture and test composites
Define a fiber-reinforced material, conduct virtual tests, simulate processing and load the laminate to first-ply failure.
-
1
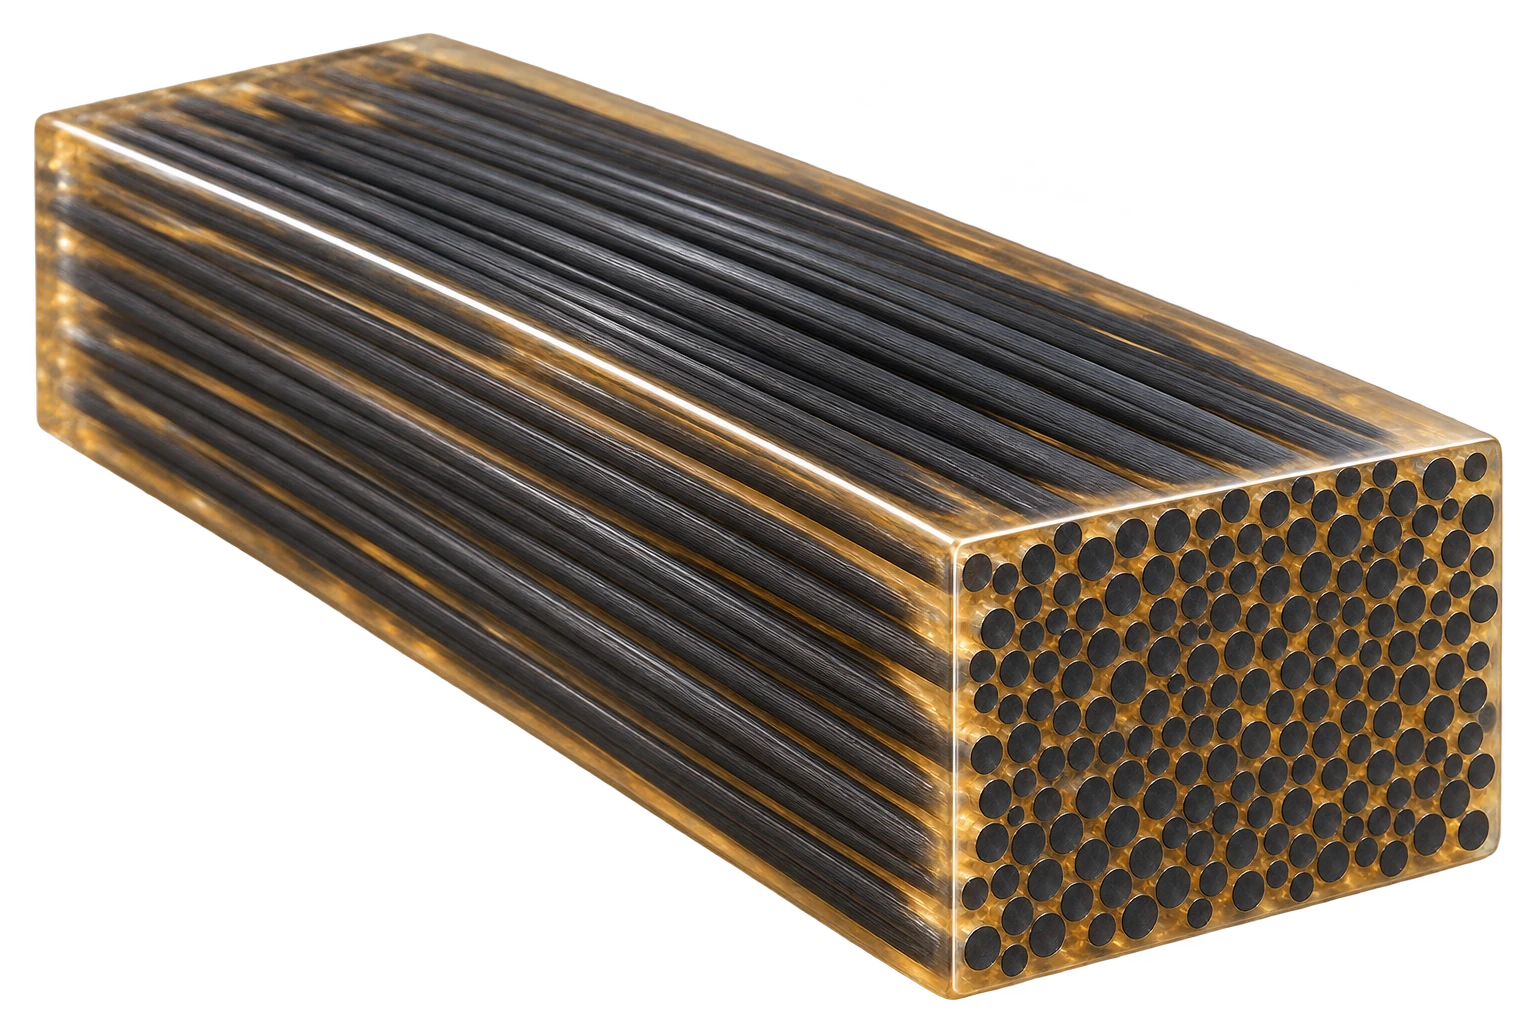 MaterialsExplore how constituents and volume fractions affect estimated properties.
-
2
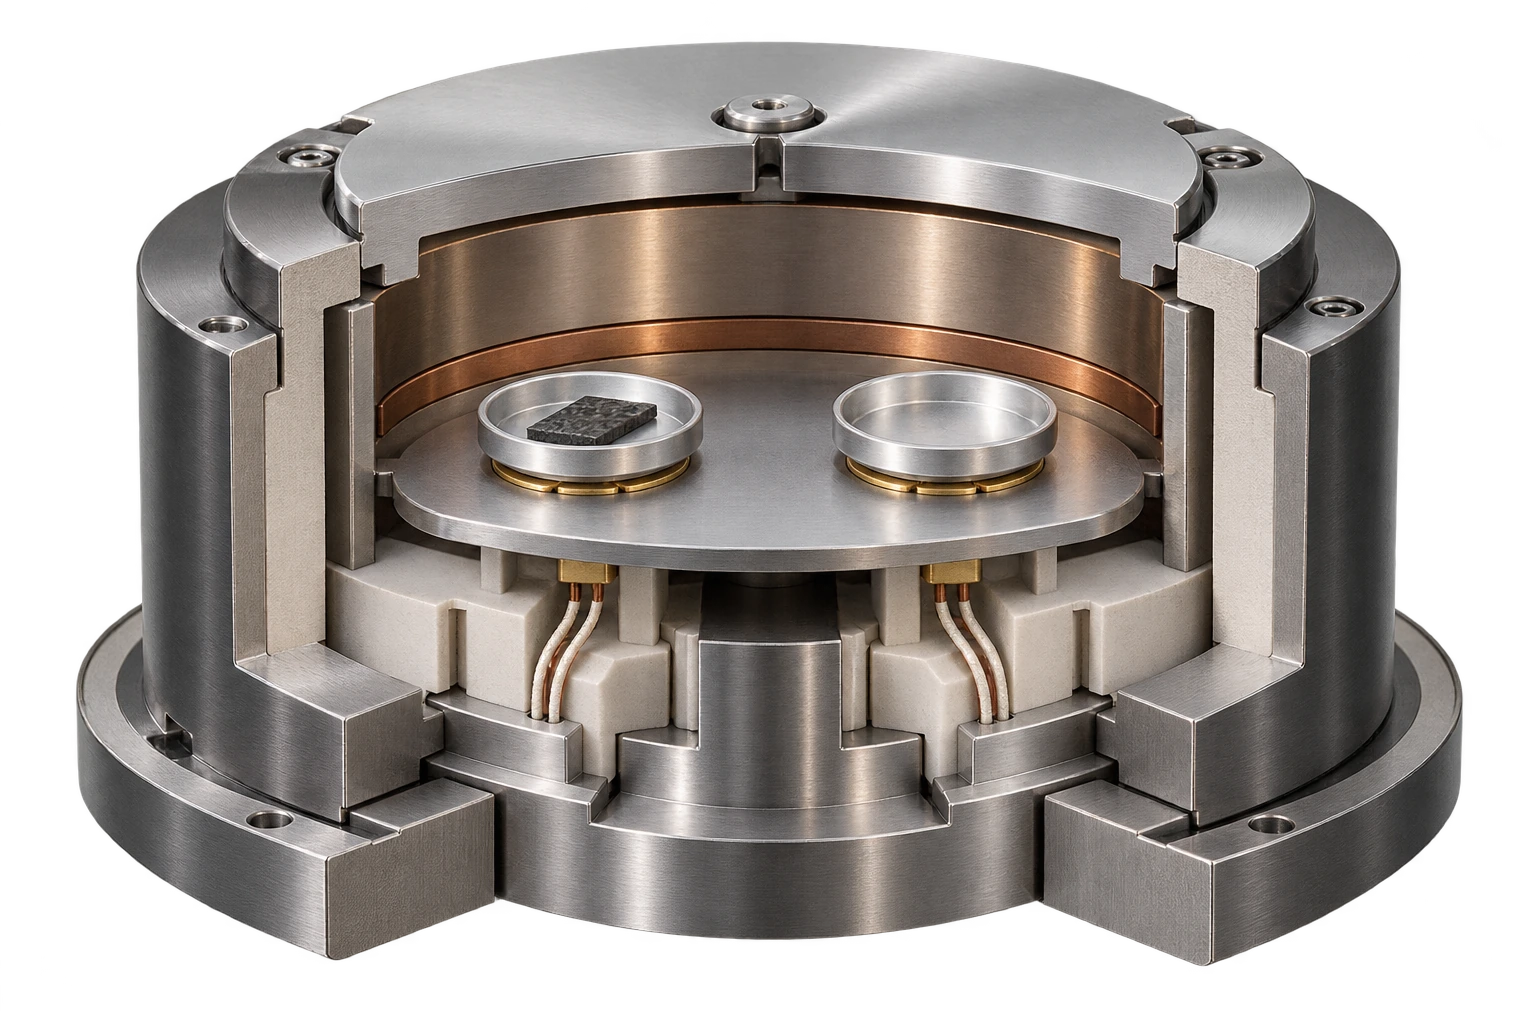 CharacterizationMeasure fiber, resin and void content, cure kinetics and viscosity, and inspect parts with ultrasound.
-
3
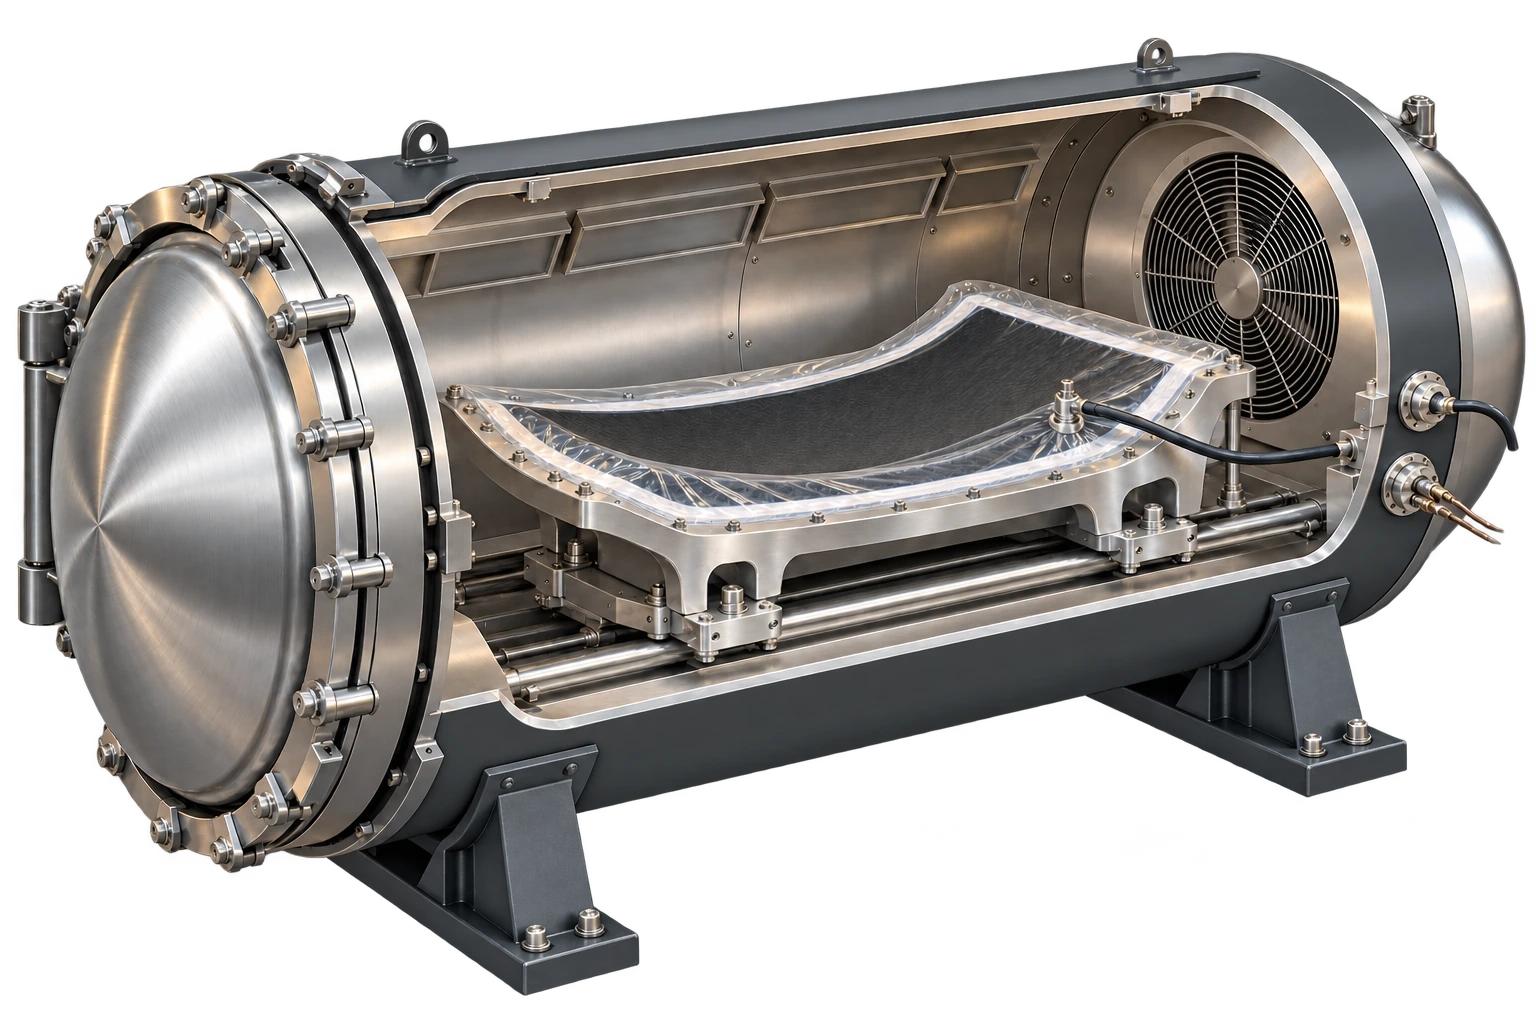 ManufacturingCompare manufacturing methods, then simulate resin infusion and cure.
-
4
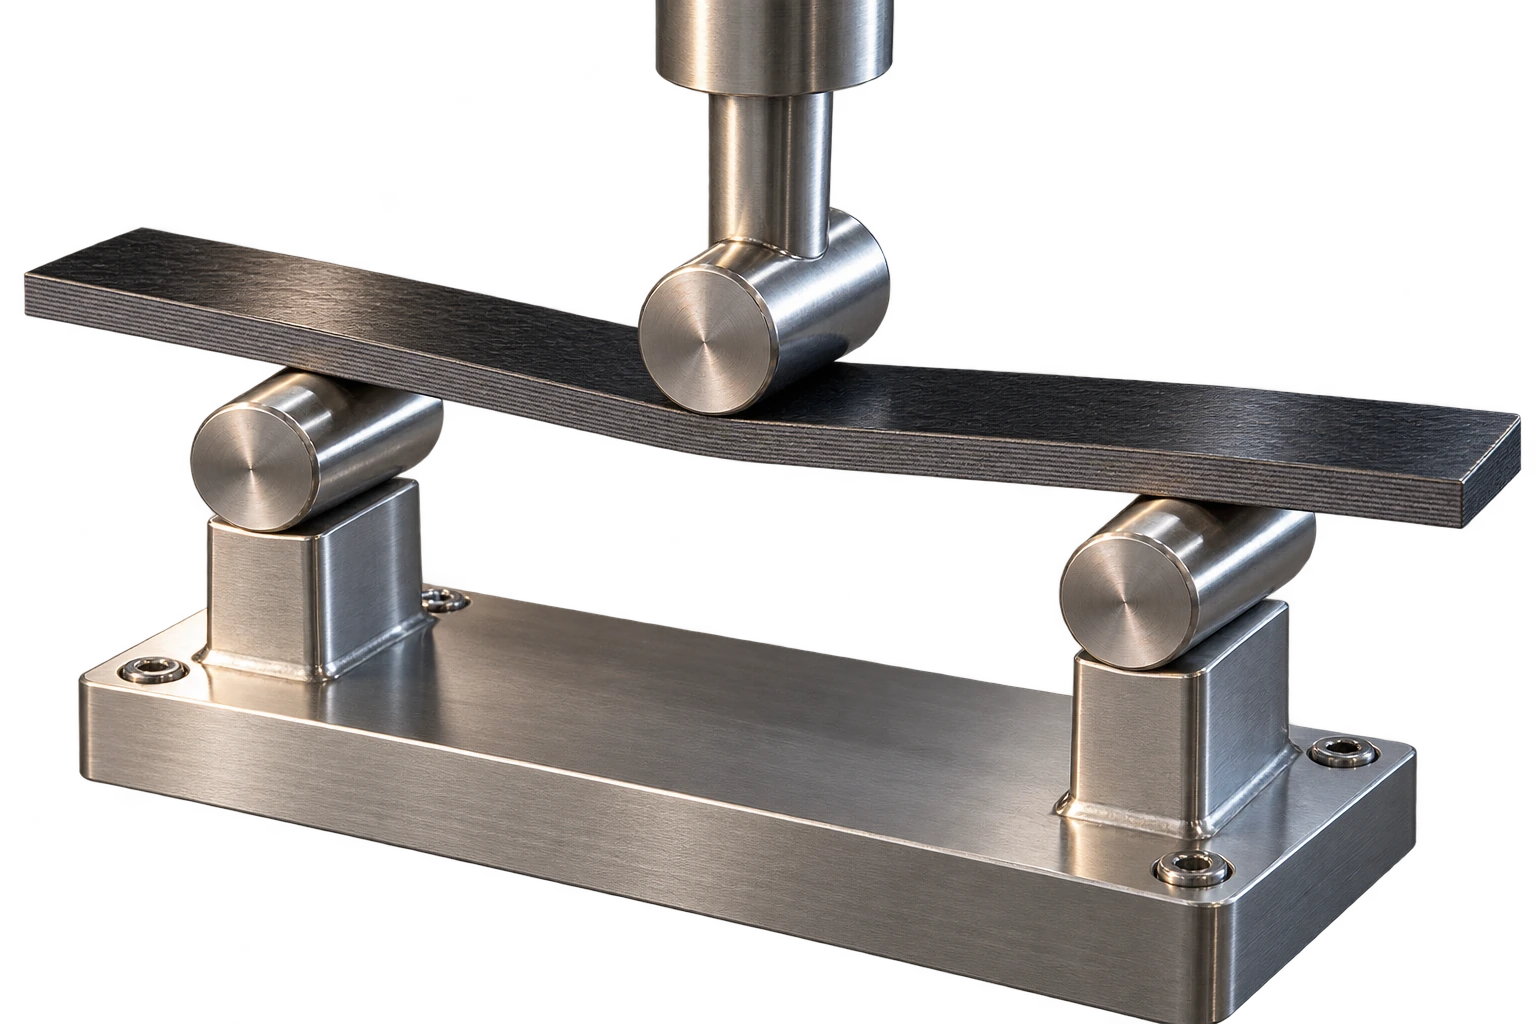 Mechanics & FailureAnalyze ply and laminate stiffness, deformation and first-ply failure.
Educational simulations and illustrative material models. AI-generated images (ChatGPT), not to scale.
1Pick a fiber and resin
Solvay CYCOM 890RTM: E and tensile strength from the Solvay datasheet (MatWeb), compression from Gargiuli et al. 2023, density from Struzziero et al. 2019. ν and price are estimates.
Hexcel 8552 Epoxy resin · 0% voids
2Set ply directions
Always 100%Fiber, volume fraction and layup
Select a fiber, its volume fraction, a resin and the ply percentages, then compare stiffness, strength, mass and cost. Every design is a 3 mm, 32-ply symmetric, balanced laminate.
Set your design on the left, then select Compare designs.
32 plies · 3 mm total · symmetric & balanced
Your design · hover to preview, click to load
Specific stiffness & strength
Per unit density · log scalesDirectional stiffness
Stiffness in x versus yEstimated tensile strength
First-ply failure in x versus y · log scalesMass & raw material cost
One marker per fiber · independent of ply directionReading the plots & model assumptions
Marker shape identifies the fiber. Color identifies the layup: more than 50% of plies at 0°, 90° or ±45° forms a dominated group; the rest are mixed. Shaded envelopes group the selected fiber’s sampled layups. They do not represent additional designs. At zero fiber content, ply directions are physically equivalent.
The main map uses specific stiffness E/ρ in MN·m/kg and specific strength σ/ρ in kN·m/kg. Choose x or y loading above that map. Both axes on this map, and both strength axes, use logarithmic scales so weak and strong directions remain readable. Axes are fixed for all five fibers and 0–70% fiber volume.
All five fibers are compared at the same selected fiber volume fraction, using the resin chosen in step 1 (Hexcel 8552 or Solvay CYCOM 890RTM) and zero voids. Every panel is 3 mm thick with 32 equal-thickness, symmetric and balanced 0°/90°/±45° plies. Layup changes mechanical response, while mass and raw material cost stay fixed at a given fiber and volume fraction.
Stiffness uses classical laminate theory. Estimated tensile strengths use the constituent-based maximum-strain model in separate uniaxial x and y tensile tests. First-ply failure is initiation, not ultimate strength. Fully cured, room-temperature estimates. Bending, buckling, compression, progressive damage, manufacturing cost and waste are outside this study.
This study is independent of the shared material until you select Open in Laminate Builder. Hover or focus a marker for a graphical layup and every property; click to load the design. Arrow keys explore points. A ring marks the same selected design in all four plots.
Define your specimen
The test and all five reference specimens have the same thickness and test settings.
After the first run, the signals follow your changes.
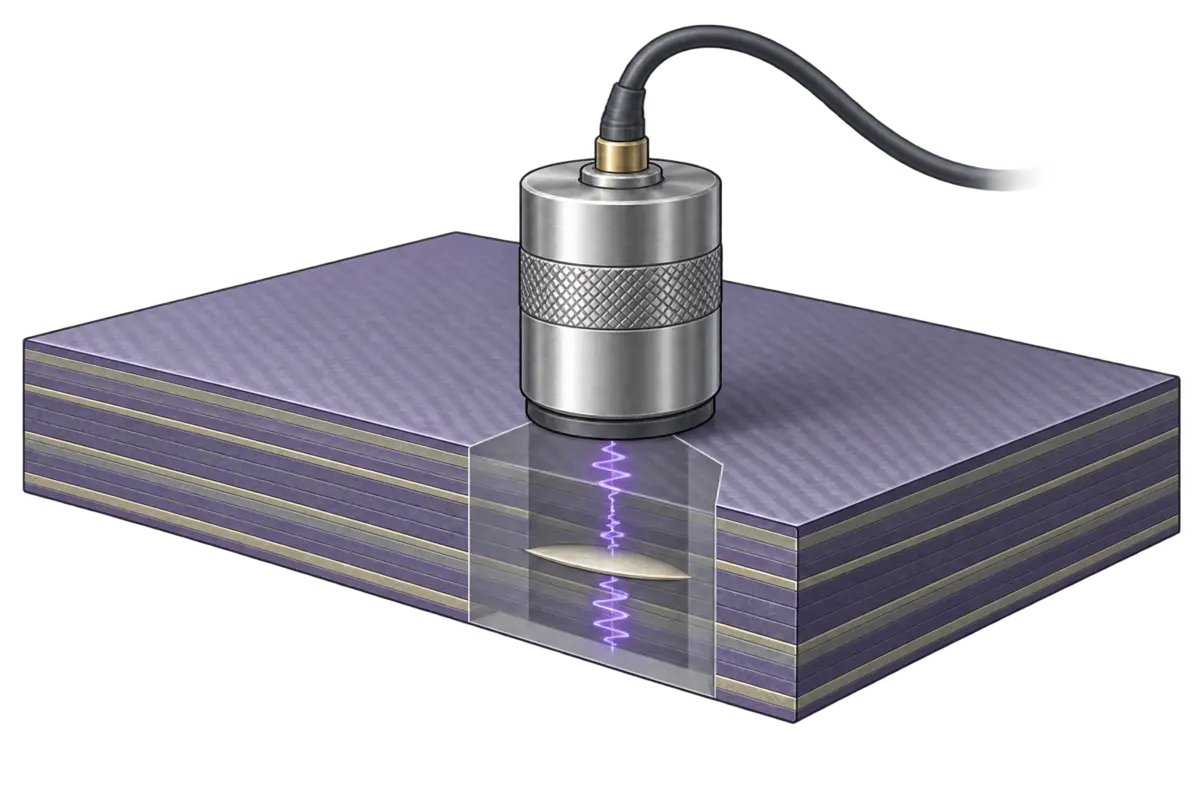
Porosity and delamination detection
Compare reference specimens with 0, 2, 4, 6 and 8% porosity. Porosity attenuates the backwall echo; a delamination returns an earlier echo.
An illustrative reference set for learning, rather than measured calibration data.
Compare the echoes
Model and reference assumptions
These are synthetic echo envelopes for a nominal 2.5 MHz test, with fixed amplitude scaling, coupling and acoustic velocity (3 mm/µs). All reference specimens have the same thickness. Porosity is a separate teaching input; Material Builder does not supply measured acoustic properties.
Pressure amplitude follows A = A₀ exp(−2αd), with d in mm and α = 0.02 + 0.0125p in Np/mm, where p is porosity in percent (0–8). The slope is illustrative, not fitted to measured 8552 data. Real calibration depends on material, layup, frequency, void morphology, thickness and coupling.
The delamination is one planar reflector at the selected depth, with nominal pressure reflection coefficient r = 0.9. Its earlier echo is attenuated over its own round trip; the backwall echo is multiplied by 1 − r². Multiple reverberations, scattering noise and full wave propagation are omitted. Echoes may overlap when an interface is close to a surface.
A weak backwall echo alone cannot distinguish porosity from a delamination or poor coupling. A specimen with an extra interface echo should not be assigned a porosity by this amplitude calibration.
Background: Johnston et al., thermal and ultrasonic evaluation of porosity; reference calibration. These sources support the teaching concepts, not the numerical coefficients used here.
Test a lamina
The same stiffness and strain limits are used in Laminate Builder and Mechanical Tests.
Compare 0°, 45° and 90°. The curve ends at estimated first failure.
Stiffness and strength versus fiber angle
A unidirectional ply is stiff and strong along the fibers and weak across them. Load it off-axis and see how the modulus and first-failure stress fall with angle.
Select Run lamina test, then drag the fiber angle.
Thermal resistance
R = 1/h for the air and L/k for each layer, in 10⁻³ m²K/W (part k at 100 °C, uncured). The largest resistance limits how fast heat gets in during heat-up, and how fast exotherm heat gets out.
The result is checked against these limits everywhere in the part.
4Try a cycleChoose a starting point
Temperature and degree of cure through the thickness
Circulating hot air heats the part and tool. Run the cycle to explore thermal lag, exotherm and degree of cure through the part.
Adjust the setup on the left, then select Run.
Material state through the part
Local part temperature and cure · αgel = 0.5 · Glassy band: Tg ≥ T + 25 °C (state convention).
Overshoot is the largest amount by which the part temperature exceeds the air temperature; thermal lag is the largest amount by which it trails (heat-up and holds only). Max heating rate is the largest dT/dt the part reaches at that point, from the solved temperatures at every time step.
1Material
2Infusion
3Cure after the part fills
Cure temperature raised to the fill temperature.
4Properties
Fiber preform
5Try an exampleOne-click cases
Fill the part before the resin gels
Vacuum pulls resin from the inlet through the dry fibers to the vent. A hotter mold makes the resin thinner, so it flows faster, but it also cures faster. Run the cycle to watch the flow front and the degree of cure.
Adjust the setup on the left, then select Run.
The part
Flow front
Resin
1Define constituents and fractions
Toughened amine-cured epoxy for aerospace prepreg; cured at about 180 °C.
Maximum fiber volume fraction: 70%.
2Explore assumptionsComposition, failure and constituent data
Composition by volume and mass
Estimated ply failure properties
Calculated from the constituents, fiber content and voids. Both virtual tests use these limits.
| Failure mode | Strength MPa | Strain % |
|---|
Model equations
Fiber and resin data
Constituents and volume fractions
Choose fibers and their volume fractions. See how composition changes stiffness, strength, thermal properties and raw material cost.
Adjust the setup on the left, then select Run.
All properties & plot choices
Use + to add a plot. Selected plots have a filled dot.
Equations
Composition
Voids sit in the resin, so Vm = 1 − Vf − Vv, and the share of the resin that is void is p = Vv / (Vm + Vv).
ρ = Vf ρf + Vm ρm wf = Vf ρf / ρ wr = 1 − wf
Elastic properties
Porous resin: Em′ = Em (1 − p)², Gm′ = Em (1 − p)² / [2 (1 + νm)]
E1 = Vf Ef1 + (1 − Vf) Em′ (rule of mixtures)
P / Pm = (1 + ξ η Vf) / (1 − η Vf), η = (Pf/Pm − 1) / (Pf/Pm + ξ) (Halpin–Tsai)
with P = E2, ξ = 2 (fiber Ef2) and P = G12, ξ = 1 (fiber Gf12).
ν12 = Vf νf + (1 − Vf) νm
Heat
Resin conductivity km = 0.148 + 3.43×10⁻⁴ T + 0.0607 α (W/m·K, T in °C), reduced by voids as km′ = km (1 − p) / (1 + p/2) (Maxwell).
k11 = Vf kf1 + (1 − Vf) km′
k33 = km′ [1 − 2√(Vf/π) + (1/B) (π − (4/s) tan⁻¹( s / (1 + B √(Vf/π)) ))], B = 2 (km′/kf2 − 1), s = √(1 − B² Vf/π) (Springer–Tsai)
If resin and transverse fiber conductivities are equal, k33 equals that same conductivity.
cp = (Vf ρf cpf + Vm ρm cpm) / ρ
1D cure uses k33 and cp at every time step, at the local temperature and degree of cure; the resin cpm also changes as the resin vitrifies.
Cure
Heat of reaction of part: Hpart = HR wr (J/g)
Volumetric heat of reaction of part: Hvol = HR ρm Vm / 1000 (MJ/m³)
HR = 600 J/g of uncured Hexcel 8552 Epoxy resin (Van Ee and Poursartip 2009) or 430 J/g of uncured Solvay CYCOM 890RTM Epoxy resin (Khoun, Centea and Hubert 2010); ρm is resin density in kg/m³. Part values include the fiber and resin fractions. Only the resin releases reaction heat.
Two fibers and cost
A mix uses fiber properties averaged by volume (by mass for cp). Constituent cost per kg = Σ wi ci, with wi = Vi ρi / ρ for each fiber and the resin. Voids add no mass or cost. Fixed teaching prices: E-glass $2/kg, S-glass $15/kg, Kevlar 49 $20/kg, AS4 carbon $25/kg, IM7 carbon $40/kg, Hexcel 8552 Epoxy resin $10/kg and Solvay CYCOM 890RTM Epoxy resin $12/kg (estimate). These nominal values illustrate relative costs, rather than supplier quotations. This estimate excludes prepreg conversion and manufacturing costs.
1Layup
Layup
Enter layup as text
Use commas, spaces or slashes.
2Ply thickness or areal weight
All fibers combined, excluding resin.
Uses the fiber volume fraction and composition from Material.
Mass per ply by constituent
3Try a layupChoose a starting stack
Stacking sequence and laminate stiffness
Arrange ply directions and define the thickness. Then see the stack, directional stiffness and equivalent laminate properties.
Adjust the setup on the left, then select Run.
The ply stack
Stiffness by direction
Membrane Young’s modulusABD matrices & full properties
The main plot and cards show membrane properties with bending restrained (κ = 0), calculated from A. The free-to-bend response (M = 0) includes extension–bending coupling and can be softer for an asymmetric layup. Compare both below.
Ply coordinates & conventions
Ply 1 starts at z = −h/2. The bottom is z = +h/2. Positive angles are counterclockwise from x when viewed from above. Engineering shear: ε(z) = ε⁰ + zκ.
Equations and assumptions
Classical laminate theory: linear elastic, plane stress, perfectly bonded plies. Ply E₁, E₂, G₁₂ and ν₁₂ come from Material. These elastic constants are fixed estimates, independent of the cure simulation. Transverse shear deformation is omitted.
ν₂₁ = ν₁₂ E₂/E₁; Q₁₁ = E₁/(1 − ν₁₂ν₂₁); Q₂₂ = E₂/(1 − ν₁₂ν₂₁); Q₁₂ = ν₁₂ E₂/(1 − ν₁₂ν₂₁); Q₆₆ = G₁₂.
Q̄ is the plane-stress ply stiffness rotated by each ply angle using engineering shear.
A = Σ Q̄ₖ (zₖ − zₖ₋₁); B = ½ Σ Q̄ₖ (zₖ² − zₖ₋₁²); D = ⅓ Σ Q̄ₖ (zₖ³ − zₖ₋₁³).
{N; M} = [A B; B D] {ε⁰; κ}. Main display: aₘ = A⁻¹; Eₓ = 1/(h aₘ₁₁), Eᵧ = 1/(h aₘ₂₂), Gₓᵧ = 1/(h aₘ₆₆), νₓᵧ = −aₘ₁₂/aₘ₁₁. These are membrane properties with κ = 0.
For the free-to-bend properties (M = 0), use the upper-left block a of ABD⁻¹ in place of aₘ. For B = 0 the two definitions coincide. With the same material and orientation fractions, membrane properties are independent of stacking order. Bending properties and coupling can still change.
Bending: Eₓᵇ = 12/(h³ d₁₁), Eᵧᵇ = 12/(h³ d₂₂), Gₓᵧᵇ = 12/(h³ d₆₆), νₓᵧᵇ = −d₁₂/d₁₁.
Per ply: FAW = t Vf Σ qiρi; FAWi = t Vf qiρi; resin areal mass = t (1 − Vf − Vv)ρr. Here t is in mm, densities in kg/m³ and areal masses in g/m². qi is each fiber’s volume share within the fibers. Total ply areal mass includes resin; voids add no mass.
Mass/area = ρh; constituent cost/area = (mass/area) × material cost/kg. Laminate thickness is reported here; the independent 1D cure thickness remains editable.
Reference: NASA RP-1351, Basic Mechanics of Laminated Composite Plates.
1Three-point bend testLoad–displacement and first failure
Use the current material and layup. The curve ends at estimated first-ply failure.
2Tensile testStress–strain and first failure
Report tensile modulus, stress and strain at first-ply failure. The stress–strain response does not require specimen dimensions.
Uses the same material and layup as the bending test.
Three-point bending and tension to first-ply failure
Load the laminate in three-point bending or tension. Follow the load–displacement curve and see which ply reaches its failure strain first.
Adjust the setup on the left, then select Run.
The bending specimen
Elastic loadingLoad–displacement
Equations & assumptions
Room-temperature, linear elastic response from the shared Material and Laminate definitions, independent of the simulated cure state. Loading is along laminate x. Five strain limits are calculated in Material from constituent properties, fiber volume and void fraction. Curves stop when any ply first reaches a longitudinal, transverse or engineering-shear limit. No progressive damage or ultimate laminate failure is predicted.
Tension: Nx = σ h; Ny = Nxy = 0; M = 0; [ε⁰; κ] = ABD⁻¹ [N; M].
Tensile Eₓ allows free bending (M = 0). Geometry is unnecessary for the stress–strain curve. The specimen graphic is schematic; scaled extension and contraction illustrate the elastic response.
Bending: I = bh³/12; EI = Eₓᵇ I; P = 48EI δ/L³.
Bending at midspan: Mx = PL/(4b); My = Mxy = 0; N = 0. Nominal flexural stress = 3PL/(2bh²).
At both faces of every ply: ε(z) = ε⁰ + zκ. ε₁ = m²εx + n²εy + mnγxy; ε₂ = n²εx + m²εy − mnγxy; γ₁₂ = −2mnεx + 2mnεy + (m² − n²)γxy.
For each component, divide its strain magnitude by the matching tension, compression or engineering-shear limit. The maximum ratio over all ply faces is the failure index. Scale the applied load until that index is 1. In bending, all faces are checked at midspan, where the moment is largest. First-ply failure is an initiation estimate. Transverse cracking or shear yielding need not cause ultimate laminate failure. The constituent model and its fixed teaching assumptions are listed in Material.
Equivalent narrow-beam bending uses Eₓᵇ from the laminate compliance with N = 0 and transverse/twisting moments free. The drawing shows longitudinal deflection only. Small deflections, ideal simple supports and perfect bonding are assumed. Transverse shear deformation, contact indentation, grip effects, damage and geometric nonlinearity are omitted. Nominal flexural stress is not the stress in an individual ply.
References: ASTM D3039, tensile properties; ASTM D7264, flexural properties; Roylance, beam displacements. This is a teaching simulation, not a complete implementation of either ASTM procedure.
Predicted first failure
Strain details
1Specimen
Enter your measurements. Each stage removes one constituent; the residue is what is left in the crucible.
| T °C | Mass after g | Removed | ρ g/cm³ |
|---|---|---|---|
Leave unused stage rows empty. Results update as you type.
Staged burn-off in air
Heat the specimen in air in steps. Each hold burns off one constituent (epoxy 350 °C, Kevlar 450 °C, AS4 550 °C, IM7 600 °C); glass does not burn and stays in the crucible. Weigh after every hold, then use the masses, densities and original volume to find Vf, Vm and Vv.
Note: these staged temperatures are for demonstration. The calculation follows ASTM D3171 and D2734, but real tests use one 565 °C burn for glass composites (ASTM D2584) or acid digestion for carbon composites (ASTM D3171).
Select Start burn-off test, or switch to My lab data to analyze your own measurements.
Show the calculation
Method, equations and assumptions
Removed mass mi = m(before) − m(after). Volume vi = mi/ρi. Volume fraction Vi = vi/V₀ and weight fraction Wi = mi/m₀. Void fraction Vv = 1 − ΣVi. Composite density ρc = m₀/V₀. Always divide by the original bulk volume V₀, never by the volume of the residue.
Burn temperatures in air: epoxy 350 °C, Kevlar 49 450 °C, AS4 carbon 550 °C, IM7 carbon 600 °C; glass fiber does not burn. The furnace holds at each burn temperature in turn, so each hold removes one constituent while everything with a higher burn temperature survives. Glass is always the final residue. Because AS4 and IM7 burn at different temperatures they can be separated; two glass fibers cannot, so a glass/glass hybrid gives one combined glass volume fraction. Each hold runs to constant mass with complete, selective removal and no char or sizing residue. When two constituents leave in the same hold (two glass grades stay together as the residue), the notebook uses their combined density.
In the virtual test the balance reads to 0.001 g and V₀ to 0.01 cm³, as in a lab, so the recovered void fraction differs slightly from the value set in Material Builder. Small voids come from the difference of large numbers, so measurement resolution matters.
The hold temperatures here are teaching values chosen so each constituent leaves on its own; they are not the ASTM conditions. In practice: ASTM D2584 (ignition loss at 565 °C) for glass composites, ASTM D3171 (acid digestion of the matrix) for carbon composites, since carbon fibers oxidize in air and aramid burns with the resin, and ASTM D2734 for void content from density. Background: McDonough et al., carbon/glass hybrid constituent and void content (NIST, 2004).
1Sample
This sets the resin of your shared material, so Rheology, Cure Simulation and Material Builder use it too.
Properties
2Temperature program
Each hold starts at its temperature, with no heat-up ramp.
A small resin sample that follows the set temperature exactly, so there is no thermal lag.
3Try a cycleChoose a starting point
About the modelEquations and references for both resins
The sample follows the program exactly, with no thermal lag. Heat flow per gram of resin is q = HR dα/dt, where HR is the total heat of reaction.
Each resin has its own cure kinetics model, fitted to DSC data: the degree of cure α rises at the rate dα/dt below. Tg rises with α (DiBenedetto); near vitrification (Tg close to T) a diffusion term slows the cure.
Hexcel 8552 In use
Cure kinetics
Chemical and diffusion rates in series:
A1 = 1.539×10⁵ s⁻¹, Ea1 = 64.93 kJ/mol; K2 = 2000 s⁻¹; A3 = 3.963×10¹¹ s⁻¹, Ea3 = 133.17 kJ/mol; R = 8.314 J/mol·K, T in K.
Diffusion control near vitrification: b = 0.021 for Tg below 120 °C, 0.031 above 195 °C, linear between. The cure stops when f ≤ 0.
Heat of reaction, Tg and gel point
HR = 600 J/g of resin. DiBenedetto Tg:
Tg0 = −7 °C, Tg∞ = 250 °C, λ = 0.78. Gel point α = 0.5.
Reference: Van Ee and Poursartip, HexPly 8552: Material Properties Database for use with COMPRO CCA and Raven, Convergent Manufacturing Technologies, 2009, pp. 7 and 12 (NIAR NCAMP 8552 resources).
Solvay CYCOM 890RTM In use
Cure kinetics
Autocatalytic rate with a diffusion factor:
A = 58,528 s⁻¹, E = 68.98 kJ/mol, m = 0.63, n = 0.6; diffusion: C = 15.66, αC0 = −0.90, αCT = 0.0039 K⁻¹; R = 8.314 J/mol·K, T in K. The diffusion factor slows the cure as α approaches the critical cure αC0 + αCTT.
Heat of reaction, Tg and gel point
HR = 430 J/g of resin. DiBenedetto Tg:
Tg0 = −14.23 °C, Tg∞ = 213.75 °C, λ = 0.396. Gel point α = 0.70 (G′ = G″ at 1 Hz).
Reference: Khoun, Centea and Hubert, Characterization methodology of thermoset resins for the processing of composite materials: case study CYCOM 890RTM epoxy resin, J. Compos. Mater. 44 (2010) 1397, eqs. 3, 4 and 8.
Full citations and the app's adaptations: About & License → Models and assumptions.
Reaction heat flow during cure
A resin sample and reference follow the same temperature program. The plotted signal is reaction heat flow per gram of resin.
Define a program, then select Run DSC test.
1Resin and material stateHexcel 8552 Epoxy resin
This sets the resin of your shared material, so DSC, Cure Simulation and Material Builder use it too.
2Temperature cycle
3Try a cycleOne hold, or cool and reheat
About the modelEquations and references for both resins
Viscosity follows the resin's flow model up to gelation. The material state (liquid, gel, rubber, glass) uses the degree of cure from the DSC cure kinetics and Tg.
Vitrification uses the convention Tg ≥ T + 25 °C. The glass transition occurs over a temperature range, not at one temperature; the bands use this threshold.
After gelation the illustrations are qualitative: storage modulus, loss modulus and frequency dependence are not calculated.
Hexcel 8552 In use
The gelation factor multiplies both temperature terms. Gel point αgel = 0.5, used for gelation and for the viscosity divergence; the reference fit used 0.545.
Reference: Van Ee and Poursartip, HexPly 8552: Material Properties Database for use with COMPRO CCA and Raven, Convergent Manufacturing Technologies, 2009, pp. 107 to 110 (NIAR NCAMP 8552 resources).
Solvay CYCOM 890RTM In use
Fitted to parallel-plate tests at 1 Hz from 80 to 190 °C. Gel point αgel = 0.70, where G′ = G″ in those tests, with α from the same paper's cure kinetics.
Reference: Khoun, Centea and Hubert, Characterization methodology of thermoset resins for the processing of composite materials: case study CYCOM 890RTM epoxy resin, J. Compos. Mater. 44 (2010) 1397, eqs. 5 to 7.
Full citations and the app's adaptations: About & License → Models and assumptions.
Viscosity and gelation
Heating lowers the viscosity; cure raises it until gelation (α = 0.5) ends liquid flow.
Define a cycle, then select Run rheology test.
Gelation: α = 0.5 · Glassy band: Tg ≥ T + 25 °C (state convention).
Properties
Columns: temperature (°C), heat flow (W/g) and, ideally, time. Header lines are skipped.
Data columns and units
Explore the heat under the curve
Open a dynamic DSC test file on the left. The residual heat under the exotherm gives the degree of cure of the sample before the test. Not sure of the format? .
How the degree of cure is calculated
1Design space
2Try a studyChoose a starting point
Cure-cycle processing window
Vary one or two settings. Each combination is simulated and checked against the peak-temperature and degree-of-cure specifications.
Adjust the setup on the left, then select Run.
Select results to include. Download a self-contained report that you can print or save as PDF.
Each run is compared at one point: the mid-plane of a laminate, or the facesheet point with the largest lag in a sandwich.
From constituents to laminate response
Material Builder defines the constituents, fiber volume fraction and void content. Characterization, process simulation and the laminate stiffness and failure analyses all use this one material definition.
Use, cite and license
Free to use, share and adapt with credit.
Cite as
Zobeiry, N. (2026). UW Composites Analysis: interactive composite materials lab [Web application]. University of Washington. https://doi.org/10.5281/zenodo.23431546
BibTeX
@software{zobeiry_uw_composites_analysis_2026,
  author    = {Zobeiry, Navid},
  title     = {{UW Composites Analysis}: interactive composite materials lab},
  year      = {2026},
  publisher = {University of Washington},
  doi       = {10.5281/zenodo.23431546},
  url       = {https://composites.uw.edu/analysis/}
}
Images and drawings. Photo-style images and micrograph-style views were generated with ChatGPT (OpenAI) from the author's written descriptions and reviewed by the author for scientific accuracy. They are representative illustrations, not photographs of real parts or measured micrographs. Some schematic drawings, molecular diagrams and charts were drawn in code with Claude (Anthropic).
Privacy. Calculations run in your browser; your inputs are not sent anywhere. Page visits are counted anonymously with GoatCounter, without cookies or personal data.
Trademarks. Product and process names such as SCRAM (Electroimpact), Hexcel 8552, CYCOM 890RTM (Solvay) and Cetex (Toray) belong to their owners. They are used only to identify the materials and processes described and do not imply endorsement.
Full license text and third-party notices
Software: MIT License. Original educational text and diagrams: Creative Commons Attribution 4.0 International (CC BY 4.0). Credit the author, link to the source and license, and indicate changes when sharing adaptations.
Images: photo-style images and micrograph-style views were generated with ChatGPT (OpenAI); some schematic drawings, molecular diagrams and charts were drawn in code with Claude (Anthropic). Prompts and figures were written, directed and reviewed by the author. They are shared under the same CC BY 4.0 terms to the extent the author holds rights in them; captions mark each AI-generated view.
Third-party libraries, fonts, referenced publications and institutional names or marks retain their own terms.
Content license notice · Third-party notices
Full MIT software license
MIT License

Copyright (c) 2026 Navid Zobeiry

Permission is hereby granted, free of charge, to any person obtaining a copy
of this software and associated documentation files (the "Software"), to deal
in the Software without restriction, including without limitation the rights
to use, copy, modify, merge, publish, distribute, sublicense, and/or sell
copies of the Software, and to permit persons to whom the Software is
furnished to do so, subject to the following conditions:

The above copyright notice and this permission notice shall be included in all
copies or substantial portions of the Software.

THE SOFTWARE IS PROVIDED "AS IS", WITHOUT WARRANTY OF ANY KIND, EXPRESS OR
IMPLIED, INCLUDING BUT NOT LIMITED TO THE WARRANTIES OF MERCHANTABILITY,
FITNESS FOR A PARTICULAR PURPOSE AND NONINFRINGEMENT. IN NO EVENT SHALL THE
AUTHORS OR COPYRIGHT HOLDERS BE LIABLE FOR ANY CLAIM, DAMAGES OR OTHER
LIABILITY, WHETHER IN AN ACTION OF CONTRACT, TORT OR OTHERWISE, ARISING FROM,
OUT OF OR IN CONNECTION WITH THE SOFTWARE OR THE USE OR OTHER DEALINGS IN THE
SOFTWARE.
ActivitiesWhat each section of the app does
Material Builder
Choose a resin (Hexcel 8552 or Solvay CYCOM 890RTM) and up to two fibers. Explore composition, stiffness, estimated strengths, thermal properties and raw material cost. Resin fills the volume left by fibers and voids.
Burn-off Test
Weigh a virtual specimen, calculate its initial bulk volume, and step through ideal staged removal. Identify constituent and void fractions when the mass losses resolve them. Overlapping losses and indistinguishable fiber grades are reported as unresolved.
DSC Test
Define a sample-temperature program and follow the heat released by cure, degree of cure and Tg. Analyze measured or virtual test data to estimate residual heat and the sample’s initial cure.
Rheology Test
Use the same My cycle program as DSC. Find the lowest resin viscosity before gelation, then explore liquid, rubbery and glassy behavior through cooling and reheating.
Ultrasound Inspection
Compare matched reference specimens with 0–8% porosity and watch the backwall echo weaken. Add a delamination to see an earlier echo and a weaker backwall return. Signals are illustrative, not measured calibration data.
Infusion Simulation
Draw a liquid resin through dry fibers by vacuum infusion or resin transfer molding. The resin cures while it flows. Follow the flow front, viscosity and degree of cure, and see whether the part fills before the resin gels.
Cure Simulation
Apply an autoclave air cycle to a part and tool. The shared material supplies density, conductivity, specific heat and heat of reaction. Follow temperature, cure and material state at different locations.
Process Map
Vary one or two processing settings to find combinations that meet your temperature and cure requirements. Select a point to investigate it in Cure Simulation.
Laminate Builder
Use the shared material in every ply. Define orientation and either thickness or fiber areal weight, then explore laminate stiffness, mass and raw material cost.
Material & Layup Explorer
Choose one fiber and its volume fraction, with zero voids. Move the layup sliders to see x/y stiffness, estimated x/y tensile strength, mass and raw material cost. Compare all fibers on linked specific-property, directional stiffness, directional strength and mass/cost maps with fixed axes.
Lamina Behavior
Rotate the angle slider to see stiffness, first-failure stress, failure strain and the tensile curve update immediately. No Run step is needed.
Mechanical Tests
Load your laminate in tension or three-point bending. Connect the response curve to the specimen and see which ply first reaches an estimated strain limit.
Reports
Keep snapshots of settings, graphs and results. Compare saved cure runs and download a report for your design study or assignment.
Reading material stateGelation, vitrification and the state timeline
At gelation (α = 0.5 for 8552, 0.70 for 890RTM) a cross-linked network spans the material; gelation is irreversible. Vitrification restricts molecular mobility; reheating can restore rubbery behavior without restoring liquid flow. The state timeline uses this convention: glassy when Tg ≥ T + 25 °C. Illustrations show dominant behavior qualitatively.
Interpreting mechanical resultsWhat the stiffness and failure results include
Laminate stiffness and mechanical tests use fully cured, room-temperature constituent estimates. They are independent of the cure simulation. Curves stop at estimated first-ply failure; process-induced residual stresses, progressive damage and ultimate laminate capacity are not included.
EquationsEvery equation the app uses, by activity
Material Builder
Composition
Resin fills the volume left by fibers and voids.
Composite density. Voids have no mass.
Fiber and resin weight fractions.
Void fraction within the resin region, and the solid fraction of that region.
Stiffness
Porous resin.
Rule of mixtures along the fibers.
Rule of mixtures. Voids are neglected.
Halpin–Tsai: E2 with Pf = Ef2, ξ = 2; G12 with Pf = Gf12, ξ = 1.
Strength (teaching estimate)
Each strength is a modulus times a strain limit. The same limits are used for first-ply failure.
Fiber-dominated tension. Superscript ⁰: void-free value at the same Vf.
Compression, capped by fiber microbuckling (Rosen type). σfC = 0.5σfT for carbon and glass, 0.1σfT for Kevlar 49.
Matrix-dominated limits, with A2 = 1 + Vf(Ef2 − Em)/(Ef2 + Em) and As = 1 + Vf(Gf12 − Gm)/(Gf12 + Gm).
Thermal properties and cost
In-plane conductivity; porous resin by the Maxwell form. Hexcel 8552: km = 0.148 + 3.43×10⁻⁴T + 0.0607α W/m·K (T in °C). Solvay CYCOM 890RTM: km = (1 + 0.70α) / (−41.8 + 0.115T) W/m·K with T in K (Struzziero, Remy and Skordos 2019), measured at 154 and 175 °C; outside that range the app holds T at the nearest end, an estimate.
Through-thickness conductivity (Springer–Tsai), with B = 2(km′/kf2 − 1) and S = √(1 − B²Vf/π).
Specific heat, weighted by mass.
Raw material cost per kg; Cf and Cm are prices per kg. Voids cost nothing.
Two fibers: fiber properties are averaged by each fiber’s share of the fiber volume (specific heat and price by mass), then used as one fiber. Match target changes Vf (with two fibers, also the split between them) to minimize Σ[(Y − Y*)/Y*]² for the two plotted properties.
Burn-off Test
Mass lost in each hold.
Volume and weight fractions. Always divide by the original bulk volume V₀.
Void fraction. The sum includes the glass residue.
Composite density.
Holds in air: epoxy 350 °C, Kevlar 49 450 °C, AS4 550 °C, IM7 600 °C. Glass does not burn and remains as the residue. Removal is ideal: complete, selective and without char.
DSC Test
Hexcel 8552
Hexcel 8552 cure rate: chemical and diffusion rates in series (Van Ee and Poursartip 2009).
K2 = 2000 s⁻¹.
A1 = 1.539×10⁵ s⁻¹, Ea1 = 64.93 kJ/mol.
A3 = 3.963×10¹¹ s⁻¹, Ea3 = 133.17 kJ/mol. R = 8.314 J/mol·K, T in K.
Diffusion control near vitrification. b = 0.021 for Tg below 120 °C, 0.031 above 195 °C, linear between. The rate stops when f ≤ 0.
DiBenedetto for 8552: Tg0 = −7 °C, Tg∞ = 250 °C, λ = 0.78.
Solvay CYCOM 890RTM
Autocatalytic rate with a diffusion factor (Khoun, Centea and Hubert, J. Compos. Mater. 44 (2010) 1397, eqs. 3 and 4). A = 58,528 s⁻¹, E = 68.98 kJ/mol, m = 0.63, n = 0.6, C = 15.66, αC0 = −0.90, αCT = 0.0039 K⁻¹; T in K.
DiBenedetto for 890RTM: Tg0 = −14.23 °C, Tg∞ = 213.75 °C, λ = 0.396 (Khoun et al. 2010, eq. 8).
Both resins
Heat flow per gram of resin. HR = 600 J/g for 8552, 430 J/g for 890RTM (Khoun et al. 2010).
Residual heat from a dynamic scan and the initial degree of cure. Wm = 1 for neat resin.
Fresh resin starts at α₀ = 0.005. Gelation at αgel = 0.5 for 8552 and 0.70 for 890RTM (G′ = G″ at 1 Hz, Khoun et al. 2010). Vitrification when Tg ≥ T + 25 °C.
Rheology Test
Hexcel 8552 viscosity (Van Ee and Poursartip 2009). A1 = 7.50×10⁻¹¹ Pa·s, E1 = 81.91 kJ/mol; A2 = 4.81×10⁻² Pa·s, E2 = 13.23 kJ/mol; T in K.
Solvay CYCOM 890RTM viscosity (Khoun, Centea and Hubert, J. Compos. Mater. 44 (2010) 1397, eqs. 5 to 7). A1 = 9.81×10⁻¹⁹ Pa·s, E1 = 115.31 kJ/mol; A2 = 6.41×10⁻³ Pa·s, E2 = 12.07 kJ/mol; T in K.
Irreversible. The flow curve ends at gelation.
Glassy when this holds; otherwise liquid before gelation and rubbery after gelation.
Cure and Tg follow the DSC equations, with the same temperature program.
Ultrasound Inspection
Echo arrival times. c = 3 mm/µs; d is the thickness, z the delamination depth.
Backwall amplitude with attenuation (Np/mm); Pv is porosity in %.
A delamination reflects part of the pulse (r = 0.9) and weakens the backwall echo.
Backwall loss against the 0 % reference.
Illustrative signals for learning, not calibration data.
Cure Simulation
1D heat conduction through the part, core and tool. The heat of reaction is released in the part only.
Convection to the autoclave air at the bag side (h1 = 60 W/m²K) and under the tool (h2 = 40 W/m²K).
Hexcel 8552 resin specific heat moves from rubbery (cr) to glassy (cg) values around Tg (Van Ee and Poursartip 2009).
Solvay CYCOM 890RTM (Struzziero, Remy and Skordos, J. Appl. Polym. Sci. 136 (2019) 47015, eq. 17 and Table IV): cr = 2.03 + 0.081α J/g·K, cg = 1.85 − 1.0×10⁻⁴T J/g·K, T in °C.
Specifications, by default 185 °C and 0.85 for 8552; 200 °C and 0.85 for 890RTM.
Linear finite elements through the thickness (10 per layer), Crank–Nicolson time steps of at most 5 s. In each element the cure equations (DSC) are advanced with the local temperature; ρ, k33 and cp follow Material Builder.
Infusion Simulation
One-dimensional flow along the part, line inlet at one end and vent at the other. Rigid preform: thickness and fiber fraction do not change. Filling is isothermal: resin and tool (or oven) are at the same temperature. The cure follows as a separate step: once the part is full, or the flow stops, the inlet closes, the front stops, and the tool ramps at 2 °C/min to the cure temperature, holds, and cools at 3 °C/min. Resin waiting in the heated supply cures slowly, so later resin enters slightly more cured. There is no exotherm. Each slice of resin cures for as long as it has been in the part, so the oldest resin, at the flow front, is the most cured. Flow stops if any resin in the part reaches the gel point.
Darcy: q = K ΔP / ∫ μ(x) dx, with the integral from the inlet to the front xf; front speed dxf/dt = q/φ; φ = 1 − Vf. Constant viscosity: tfill = φ μ L² / (2 K ΔP).
Permeability, in-plane along the flow: K = C (1 − Vf)³ / Vf² (Kozeny–Carman) for the fabrics, K = a Vf−b for the random mat.
| Preform | Measured data | Fitted law | Range, scatter |
|---|---|---|---|
| Non-crimp fabric | Carbon NCF, K = 1.15 × 10⁻¹⁰ m² at 41.1% (Wu, Larsson and Blinzler, Int. J. Mater. Form. 14 (2021) 421) | Kozeny–Carman through that point, C = 4.9 × 10⁻¹¹ m² | one point; Vf trend assumed |
| Woven fabric | Glass twill, K = 381.84 h4.886 from thickness h, 55 to 71% (Kessels, PhD thesis, North-West University 2006, Table B.1); glass and carbon plain weaves at 42 to 56%, K1 read from Figs. 7 and 8 (Golestanian, IUST Int. J. Eng. Sci. 18 (2007) 67) | Kozeny–Carman, C = 1.07 × 10⁻¹⁰ m², 21 points | 42 to 71%; R² 0.74, within a factor 1.7 |
| Random mat | Chopped glass mat at 16 to 24%, read from Fig. 6 (Golestanian 2007) | K = 1.66 × 10⁻¹¹ Vf−1.73 m², 7 points (Kozeny–Carman fitted worse, R² 0.37) | 16 to 24%; R² 0.61, within a factor 1.3 |
Other measurements agree within the usual scatter: glass quadriaxial NCF under vacuum, 1.2 × 10⁻¹¹ to 5.4 × 10⁻¹¹ m² (Geng et al., Polymers 12 (2020) 1525). Permeability benchmarks find a factor of 2 or more between laboratories for the same fabric (Arbter et al., Compos. Part A 42 (2011) 1157).
All these K values were measured in rigid molds with saturated or steady flow. Outside each measured range the law is extrapolated, and the Properties step says so. It is the in-plane permeability along the flow direction, and it is the same for every fiber type. Through-thickness permeability is typically 10 to 100 times lower, which matters when flow media carries the resin over the top and it then soaks down through the thickness; this 1D model leaves that out. A measured K entered in step 1, Material, replaces the model.
Cure kinetics: dα/dt = A e−E/RT αm (1 − α)n / (1 + eC(α − αC0 − αCT T)); A = 58 528 s⁻¹, E = 68 976 J/mol, m = 0.63, n = 0.6, C = 15.66, αC0 = −0.90, αCT = 0.0039 K⁻¹.
Viscosity: μ = A₁eE₁/RT + A₂eE₂/RT (αgel/(αgel − α))−0.5 + α + 3.5α²; A₁ = 9.81 × 10⁻¹⁹ Pa·s, E₁ = 115 305 J/mol, A₂ = 6.41 × 10⁻³ Pa·s, E₂ = 12 074 J/mol, αgel = 0.70.
Glass transition (DiBenedetto): Tg = Tg0 + λα(Tg∞ − Tg0)/(1 − (1 − λ)α); Tg0 = −14.23 °C, Tg∞ = 213.75 °C, λ = 0.396.
890RTM models: Khoun, Centea and Hubert, J. Compos. Mater. 44 (2010) 1397. Check: about 0.5 Pa·s at 80 °C, and gelation in about 94 min at 170 °C (paper: about 100 min, measured with rheometer heat-up).
Checks against published data
Flow solver. With cure off, the simulated fill time matches φμL²/(2KΔP) within 0.5% for five cases (30 to 150 cm, 0.95 to 6 bar, 45 to 60% fiber).
| Cure, isothermal DSC (Khoun Fig. 5) | Paper, min | Model, min |
|---|---|---|
| 160 °C: α = 0.3 / 0.5 / 0.7 | 89 / 118 / 146 | 86 / 115 / 146 |
| 170 °C: α = 0.3 / 0.5 / 0.7 | 55 / 73 / 92 | 56 / 75 / 94 |
| 180 °C: α = 0.3 / 0.5 / 0.7 | 37 / 49 / 62 | 37 / 49 / 62 |
| 190 °C: α = 0.3 / 0.5 / 0.7 | 26 / 36 / 45 | 25 / 33 / 42 |
| Viscosity (Khoun Figs. 6 and 7) | Paper | Model |
|---|---|---|
| At 80 °C, fresh resin | 0.39 Pa·s | 0.50 Pa·s |
| At 80 °C after 3 h | still liquid | 0.50 Pa·s, α = 0.007 |
| 180 °C with heat-up: 1 / 10 / 100 Pa·s | 62 / 68 / 71 min | 60 / 65 / 67 min |
| 170 °C with heat-up: 1 / 10 / 100 Pa·s | 86 / 97 / 101 min | 86 / 94 / 98 min |
| Gel time at 180 °C (G′ = G″) | 72 min | 62 min (α = 0.70, no heat-up) |
| Ramp 2 °C/min: lowest viscosity; passes 1 Pa·s rising | 0.10 to 0.12 Pa·s; 221 °C | 0.13 Pa·s; 218 °C |
Paper values are read off the figures, about ±3 min. The model is slightly early near gel and about 25% too viscous at 80 °C, so fills at 80 °C may run about 25% long. The fill time depends most on K, which is the least certain input: permeability benchmarks report scatter of a factor of 2 or more for the same fabric.
Flow case from Wu et al. (2021). Their simulation of a 35 cm VARTM part at 25 °C fills in 220 s. Our rigid 1D model with their K, fiber fraction and viscosity gives about 1270 s. Their model adds capillary pressure (about 1 bar) and a preform that relaxes as resin pressure rises, so it is not a like-for-like check. The two measured flow fronts below test fill time directly.
Measured flow front, Kessels (2006). Vacuum infusion of 10 plies of 280 g/m² glass twill, 20 cm line infusion at 0.87 bar, resin 0.346 Pa·s, front filmed through a glass mold in two runs (J.F.A. Kessels, PhD thesis, North-West University, 2006: Table 3.1, Fig. 3.4, Tables A.1 and B.1; also Kessels, Jonker and Akkerman, Compos. Part A 38 (2007) 51). K was measured in a rigid mold as a function of thickness, so the model uses K at the thickness the bag compacts the preform to.
| Glass twill, 20 cm, 0.87 bar | Front at 10 / 15 / 20 cm, min |
|---|---|
| Measured, runs 1 and 2 | 17 / 37 to 45 / 66 to 85 |
| Model, K = 1.7 × 10⁻¹¹ m² at the dry compacted 1.86 mm (59% fiber) | 8 / 18 / 31 |
| Model, K = 7.1 × 10⁻¹² m² at the wet compacted 1.55 mm (71% fiber) | 14 / 31 / 54 |
| Model, woven fabric K of this page at 59% fiber (2.1 × 10⁻¹¹ m², fitted to published data) | 6.5 / 15 / 26 |
With K from rigid-mold measurements the model fills 1.2 to 3.3 times too fast. In the real part the wet preform compacts further at the front, and behind the front it relaxes and soaks up extra resin; this model leaves both out. Measured times are read off the thesis figure, about ±5%. The thesis plots K 10 times higher than its Table B.1. That K would fill this part in 3 min, and in the thesis' second preform it puts the front 10 times too fast, so the table value is used.
Measured flow front, Wu, Larsson and Rouhi (2019), Polymers 11, 2003, the experiment behind the non-crimp fabric K: rapeseed oil (0.067 Pa·s) through 38 cm of that fabric at 0.98 bar. Thickness scans place the front near 5 cm at 29 s and 15 cm at 800 s, with the part still not full. At the nominal 41% fiber the model fills it in about 4 min. With K at the 4.2 mm the bag compacts it to (64% fiber), the model front is 5.2 cm at 29 s, close to the scans, but 27 cm at 800 s. In both experiments the real fill was slower than this model, so for vacuum infusion read the fill time here as a lower bound.
Process Map
Each run is a full Cure Simulation with the Pass rule above.
Peak temperature, lowest degree of cure and cycle time are interpolated, then checked against the specifications.
Lamina Behavior
Ply stiffness, with ν21 = ν12E2/E1.
Rotated stiffness, m = cos θ, n = sin θ; Q̄22, Q̄12, Q̄16, Q̄26 and Q̄66 follow the standard transformation.
Off-axis modulus, with S̄ = Q̄⁻¹ (free shear strain).
Strains in the ply axes.
Maximum strain criterion. The curve is linear up to first failure.
Laminate Builder
Ply interfaces, from the top surface.
Classical laminate theory.
Forces and moments per width from midplane strains and curvatures.
Equivalent laminate moduli, a = A⁻¹.
Stiffness by direction (polar plot).
Ply thickness from fiber areal weight.
Per unit area; C is the material cost per kg.
Mechanical Tests
Strain through the thickness, from [A B; B D]⁻¹ {N; M}.
Maximum strain index over every ply face, with the Material Builder strain limits.
Three-point bending: midspan moment per width.
Flexural modulus and beam stiffness (d from the inverse ABD).
Nominal flexural stress.
Tension: average stress; Ex as in Laminate Builder.
Euler–Bernoulli beam without shear deformation; the app warns when L/h < 32. Curves end at estimated first-ply failure.
Material & Layup Explorer
Ply fractions of a 32-ply symmetric, balanced laminate, 3 mm thick, with no voids.
A/h terms, with Q45 = (Q11 + Q22 + 2Q12 + 4Q66)/4.
Coupling term A12/h.
Laminate stiffness in x and y.
Strength is the first-ply failure stress (maximum strain) under load in x or y.
Per square meter of panel.
Ply properties use the Material Builder micromechanics with the resin chosen in step 1. Hexcel 8552: E = 3.25 GPa, ν = 0.43, tension 121 MPa, 1301 kg/m³, $10/kg; its 200 MPa compression is a teaching assumption. Solvay CYCOM 890RTM: E = 3.10 GPa and tension 68.9 MPa (Solvay CYCOM 890 RTM datasheet, via MatWeb), compression 128 MPa (Gargiuli et al., Polymers 15 (2023) 4022), 1130 kg/m³ (Struzziero, Remy and Skordos 2019); ν = 0.38 and $12/kg are estimates.
Methods
Ratings 1 (Low) to 3 (High). w = 1.5 at low volume, 0.75 at mid, 0.25 at high: a qualitative screening weight for investment shared by fewer parts at low volume. It is not a computed cost.
Cost level shown on each process.
Relative ratings for comparing processes, not prices.
Models and assumptionsModel choices and data sources
Materials
Longitudinal stiffness uses the rule of mixtures; transverse and shear stiffness use Halpin–Tsai. Porous resin softens as (1 − p)², where p is the void fraction within the resin region. Constituent strengths and smooth void degradation form a teaching model.
Resins: Hexcel 8552
The Hexcel 8552 Epoxy resin reference is HexPly 8552: Material Properties Database for use with COMPRO CCA and Raven, David Van Ee and Anoush Poursartip, Convergent Manufacturing Technologies, version 0.9, 15 November 2009. It is available through NIAR’s NCAMP 8552 resource page. Cure kinetics and Tg: pp. 7, 12; resin specific heat and conductivity models: pp. 8, 13–14; viscosity: pp. 107–110. The report includes fitted data and assumed properties; density and conductivity were not measured in that characterization program.
The app follows the supplied AS4/IM7 Python thermal models, with bounded integration and corrected numerical limits. Tg uses DiBenedetto with Tg0 = −7 °C, Tg∞ = 250 °C and λ = 0.78. Total reaction heat is 600 J/g of resin. Gelation uses α = 0.5, also in the viscosity divergence term; the reference viscosity fit used 0.545. The Tg ≥ T + 25 °C state boundary is a common rule of thumb, since the glass transition occurs over a temperature range. Resin flow viscosity is shown only before gelation; post-gel storage and loss moduli are not predicted. Mechanical strengths and fixed costs are teaching estimates, separate from this resin reference.
Resins: Solvay CYCOM 890RTM
The Solvay CYCOM 890RTM cure kinetics (A = 58,528 s⁻¹, E = 68,976 J/mol, m = 0.63, n = 0.6, C = 15.66, αC0 = −0.90, αCT = 0.0039 K⁻¹), total heat of reaction (430 J/g), viscosity, gel point (α = 0.70, where G′ = G″ at 1 Hz with α from the kinetics model) and DiBenedetto Tg (Tg0 = −14.23 °C, Tg∞ = 213.75 °C, λ = 0.396) are from Khoun, Centea and Hubert, J. Compos. Mater. 44 (2010) 1397. The same paper gives the processing window: injection at 80 °C, a typical cure of 2 h at 180 °C and no more than 200 °C during RTM; these set the 890RTM default cycles. Density (1130 kg/m³), specific heat and conductivity are from Struzziero, Remy and Skordos, J. Appl. Polym. Sci. 136 (2019) 47015; that conductivity fit was measured at 154 and 175 °C, so the app holds temperature within that range, an estimate elsewhere. Tensile modulus (3.10 GPa) and tensile strength (68.9 MPa) are from the Solvay CYCOM 890 RTM technical datasheet as listed by MatWeb; compressive yield strength (128 MPa) is from Gargiuli et al., Polymers 15 (2023) 4022. The elastic Poisson ratio (0.38) and the price ($12/kg) are estimates.
Characterization: Ultrasound Inspection
Pulse-echo inspection of a panel in an immersion tank, calculated point by point. Through-thickness wave speed c = √(M/ρ), where M is the constrained modulus M = E(1 − ν)/[(1 + ν)(1 − 2ν)] of the fibers (transverse) and of the resin, combined by Halpin–Tsai with the resin softened by voids as in Material Builder. Each interface returns R = (Z₂ − Z₁)/(Z₂ + Z₁) with Z = ρc: water to panel at the front surface, about −1 at a delamination (an air gap), and for a 50 µm PTFE insert the thin-layer formula, so its echo depends on frequency. Echoes arrive at t = twater + 2z/c and lose e−2αz over the round trip, with attenuation α = f(α₀ + k·Vv) rising with frequency and void content (trend from Stone and Clarke, Non-Destructive Testing 8 (1975) 137, reviewed by Birt and Smith, Insight 46 (2004) 681; the value of k is illustrative). The A-scan adds tone bursts at the probe frequency for every echo, including back-wall repeats, the second water echo, weak ply-interface echoes and scattering from voids. The C-scan repeats this on a 1.25 mm grid; where the beam covers part of a flaw, that part reflects. Not modelled: full wave propagation, beam diffraction in detail and ply-by-ply anisotropy.
Manufacturing: Infusion Simulation
One-dimensional Darcy flow through a rigid preform, filled at one temperature, then cured, with the CYCOM 890RTM models above. Permeability is fitted to measurements: non-crimp fabric from Wu, Larsson and Blinzler, Int. J. Mater. Form. 14 (2021) 421; woven fabric from Kessels, PhD thesis, North-West University, 2006 and Golestanian, IUST Int. J. Eng. Sci. 18 (2007) 67; random mat from Golestanian (2007); cross-checked with Geng et al., Polymers 12 (2020) 1525. Flow fronts are checked against Kessels (2006) and Wu, Larsson and Rouhi, Polymers 11 (2019) 2003. The fill time is a saturated estimate: measured vacuum infusions ran 1.2 to 3.3 times slower. Laminate densities are typical values (estimate).
Manufacturing: Cure Simulation
One-dimensional linear finite elements, convection on both outer faces and local temperature- and cure-dependent properties. Interfaces are perfectly bonded.
Mechanics: Lamina Behavior and Laminate Builder
Linear elastic classical laminate theory with ideal boundary conditions. Failure is first-ply failure by the maximum strain criterion, with ply strain limits from Material Builder (estimated from the fibers, resin, fiber volume and voids). Nothing is modelled after the first ply fails.
Mechanics: Mechanical Tests
Tension, Laminate Bending, Sandwich Bending and Open-Hole Tension share one failure model. Ply data are measured NCAMP values for IM7/8552 (0.125 and 0.183 mm plies) and AS4/8552 (0.188 mm), or estimates from fibers and resin. Classical laminate theory includes the cure residual stresses. Matrix cracking uses in-situ ply strengths (Camanho et al., Compos. Part A 37 (2006) 165) and a cracked ply stops carrying transverse load. Fibers fail by maximum stress at XT, the 0° strength inside a laminate, or XC. Delamination grows from cracked ply blocks at σd = √(ExGIIc/(0.47 tblock)), with 0.47 fitted to the ply-block tests of Wisnom, Khan and Hallett, Compos. Struct. 84 (2008) 21.
Laminate Bending adds interlaminar shear against the measured short-beam strength. Open-Hole Tension uses finite fracture mechanics with a hole-size factor for delamination. Sandwich Bending adds face wrinkling and core shear. Checked against published tests: unnotched tension 4.5% mean error (12 tests) and open-hole tension 7.6% (47 tests). Damage drawings are illustrative; strengths and failure modes come from the model. Each test page lists its equations and sources.
Detailed equations for each activity are in Equations above.
Set up a class activityPresets, locked fields and setup files
Choose a starting setup and use More → Save setup file. A preset block can set a title, note and locked fields, for example "preset": {"title":"Design study", "note":"Find the shortest acceptable cycle", "locked":["tool","L1","L2","T0"]}. Reports and cure history stay in the current browser unless downloaded.
Press Ctrl + Enter (or Command + Enter) to run the current activity.